生产者客户端常见异常Case解决方案集锦
kafka管控推荐使用 滴滴开源 的 Kafka运维管控平台 更符合国人的操作习惯 ,
更强大的管控能力 ,更高效的问题定位能力 、更便捷的集群运维能力 、更专业的资源治理 、 更友好的运维生态
生产者UserCallBack异常
异常日志
1 |
|
异常源码
ProducerBatch#completeFutureAndFireCallbacks
1 | private void completeFutureAndFireCallbacks(long baseOffset, long logAppendTime, RuntimeException exception) { |
这段代码是生产者调用回调接口, 每条消息都有一个thunk.callback, 当你看到这个异常日志的时候就应该知道是用户自定义的callback抛出异常了。
日志里面有提示你是哪个TopicPartition有问题。
有什么影响:
影响的是你自身的回调业务逻辑。
那么消息是发送成功还是失败了呢?
判断消息是否发送成不是UserCallBack决定的。就算你这里抛异常了,那么消息该成功还是成功。
解决办法
UserCallback这个回调很重要,它是在整个I/O线程里面的,它的性能会影响这个生产者发送消息的性能。
解决问题的办法也很简单,根据抛出来的具体异常日志进行处理,比如空指针啊什么的。或者直接这个接口里面的逻辑用异步线程处理。
消息累加器内存不够
异常日志
1 |
|
异常源码
BufferPool#allocate
1 |
|
可以看到上面的代码是在尝试向消息累加器里面插入数据, 然后在分配内存的时候发现内存不够了, 不够怎么办呢?那么等呗, 等内存够了就可以插入了
什么叫够?为什么等了可能内存就够了?
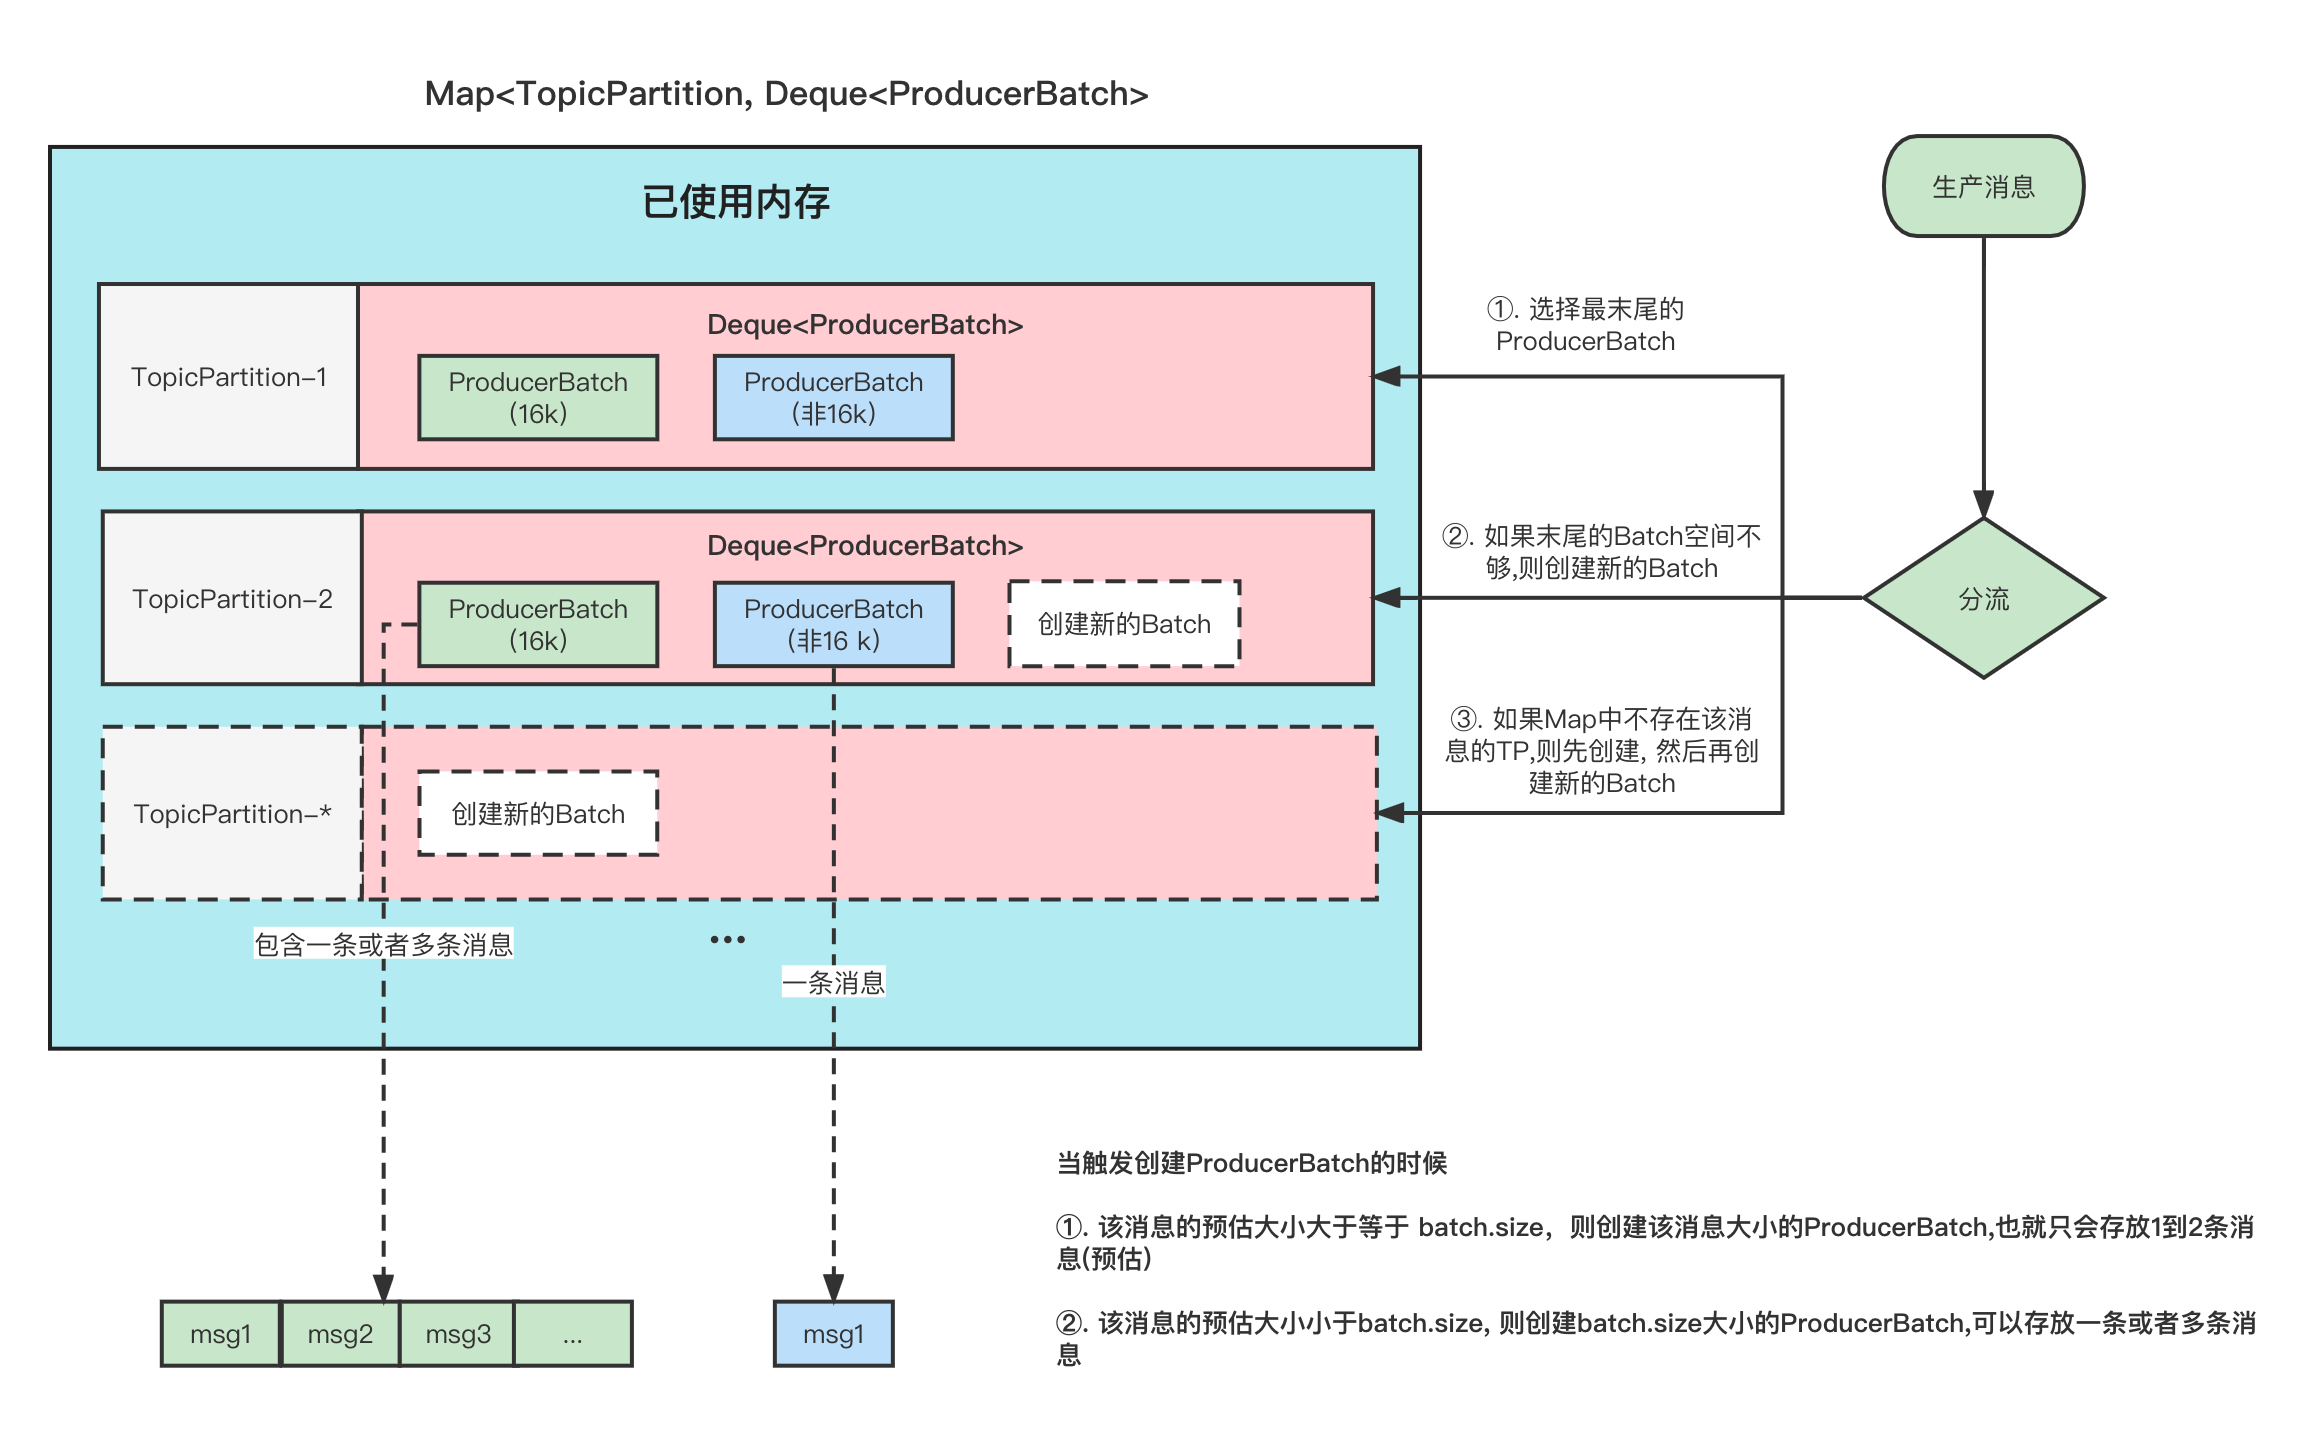
关于这个你可以看下我之前写的文章 图解Kafka Producer中的消息缓存模型
消息累加器中的内存大小是配置buffer.memory(33554432 (32M))控制的
消息发送成功了之后,会将内存释放掉,那么累加器也就可以接着缓存消息了。
当然,也不能一直等待下去吧,所以这个最大等待时间是max.block.ms(6000)。
异常原因
消息累加器满了, 这个是最根本的原因,但是造成这个现象原因确有很多。
- 消息累加器设置的太小了
- 消息生产的速度太快了
- 消息发送的速度跟不上生产的速度
解决方案
上面的原因也只是笼统的描述, 比如说 消息发送速度跟不上生产速度,那么为何会造成这种情况呢,我们又得去深究。
解决方案也没有一个统一的办法,我们只能是根据具体现象去做调优尝试。
buffer.memory尝试设置大一点。具体调整多少我觉得看你能够分配给生产者多少内存,一般情况下越大越好,如果你想寻找一个比较合适的值,我建议你可以通过JMX指标buffer-available-bytes:当前消息累加器中可用缓冲区内存大小来观察, 如果你经常看到这个值非常小,比如只有一个不到的batch.size的大小,说明内存设置太小了, 需要适当调整大一点。调整后如果在一个比较合理的范围,那么就差不多了。max.block.ms调不调整我觉得问题不大, 默认等待1分钟感觉已经挺长了,当然如果你能接受更长的等待时间(延迟),适当的调整确实能够缓解一定的问题。但是笔者认为调整其他的参数更有意义。- 检查一下自己的UserCallBack(用户回调)是不是有性能问题。因为用户回调接口是在I/O线程中执行的, 如果用户在该回调接口里面写的方法性能很差,会增加整个调用链路的时间, 链路不结束,消息了累加器中的消息就一直不能释放。
- 尝试将
max.in.flight.requests.per.connection设置大一点。 生产者针对每个Node的网络并发度是max.in.flight.requests.per.connection决定的。并发度小了消息发送速度就小, 累加器中的消息迟迟不能被发送。 - 检查是否被Broker限流了,适当调整限流值。可以通过JMX查看指标:
①.produce-throttle-time-avg(请求被Broker限流的平均时间(毫秒))
②.produce-throttle-time-max(请求被Broker限流的最长时间(毫秒))
监控
平时可以通过JMX指标(type=producer-metrics)buffer-exhausted-total(由于缓冲区耗尽而丢弃的记录发送总数)、buffer-exhausted-rate(由于缓冲区耗尽而丢弃的平均每秒记录发送数) 来监控是否出现了该种异常。
Node网络异常
异常日志
1 |
|
异常源码
Sender#completeBatch
1 | if (error.exception() instanceof InvalidMetadataException) { |
异常原因
出现上面2行警告日志的原因是分别是
1 | Received invalid metadata error in produce request on partition Topic4-0 due to org.apache.kafka.common.errors.NetworkException: The server disconnected before a response was received.. Going to request metadata update now (org.apache.kafka.clients.producer.internals.Sender) |
Request因为网络异常,开始重试,并打印了警告日志,并尝试更新元信息。一般这个日志同时会伴随着重试的日志。如下
1 |
|
但是,如果已经没有伴随重试的日志了,说明该Batch已经不满足重试条件了,后续会被处理完发送消息失败. 相关的日志如下
1 |
|
解决方案
网络都异常了,排查哪为啥网络异常。
Batch 超出交付时间
异常日志
1 |
|
异常源码
Sender#sendProducerData
1 | List<ProducerBatch> expiredInflightBatches = getExpiredInflightBatches(now); |
注意: 这里是标记了一些异常信息,然后通过UserCallBack返回,如果你没有定义在UserCallBack打印或者拦截器中打印,一般是看不到的。例如ErrorLoggingCallback这个回调类就打印了异常信息。
异常解释
这个异常是因为有一部分的ProducerBatch一直没有发送结果, 导致超出了最大交付时间delivery.timeout.ms 。这个时候会将这一部分ProducerBatch以发送失败处理。
判断是否超时的条件是:
【现在的时间 - Batch的创建时间 > 最大交付时间(delivery.timeout.ms) 】
关于本部分异常,强烈建议你先了解一下相关知识图解Kafka Producer 消息缓存模型
异常原因
造成这异常分两种情况。
1 、Batch一直处于正在发送中(inFlightBatches)
Batches的生命周期是:创建Batch -> 准备发送(inFlightBatches) -> 发送Request -> 处理Response -> 用户回调 -> 释放Batch(同时从inFlightBatches移除)
Batch自从加入到 inFlightBatches 中之后一直迟迟没有完成整个请求链路。
发送/处理Request 时间(包括重试时间)+ 处理Response + UserCallBack 用户回调 > delivery.timeout.ms
假如,发起的Request的目标Node网络异常,也会造成这个情况
2、Batch一直停留在缓存区未被发送
一般这种情况出现的概率很低, 但是不是没有可能
①. 当你的消息生产速度很快, 你设置的buffer.memory 也很大, 一下子存放了非常多的消息。
然而消息发送的性能来不及将这些缓存中的消息在 delivery.timeout.ms最大交付时间内发送出去。
那也就会有一些Batch超时了,以发送失败处理。
②. 命中Bug. 这个Bug就是我之前提的 有个成为Kafka Contributor的机会不要错过…
但是该Bug命中条件很苛刻,基本可以忽略不计。目前该Bug的PR已在Kafka_3.3版本提交合并
解决方案
- 看看是不是有NETWORK_EXCEPTION告警日志, 有可能某台Node挂掉了说不定。该异常伴随的日志请看上一个异常CASE!
- 优先查看UserCallBack回调接口是不是有性能问题, 建议用异步线程处理回调。
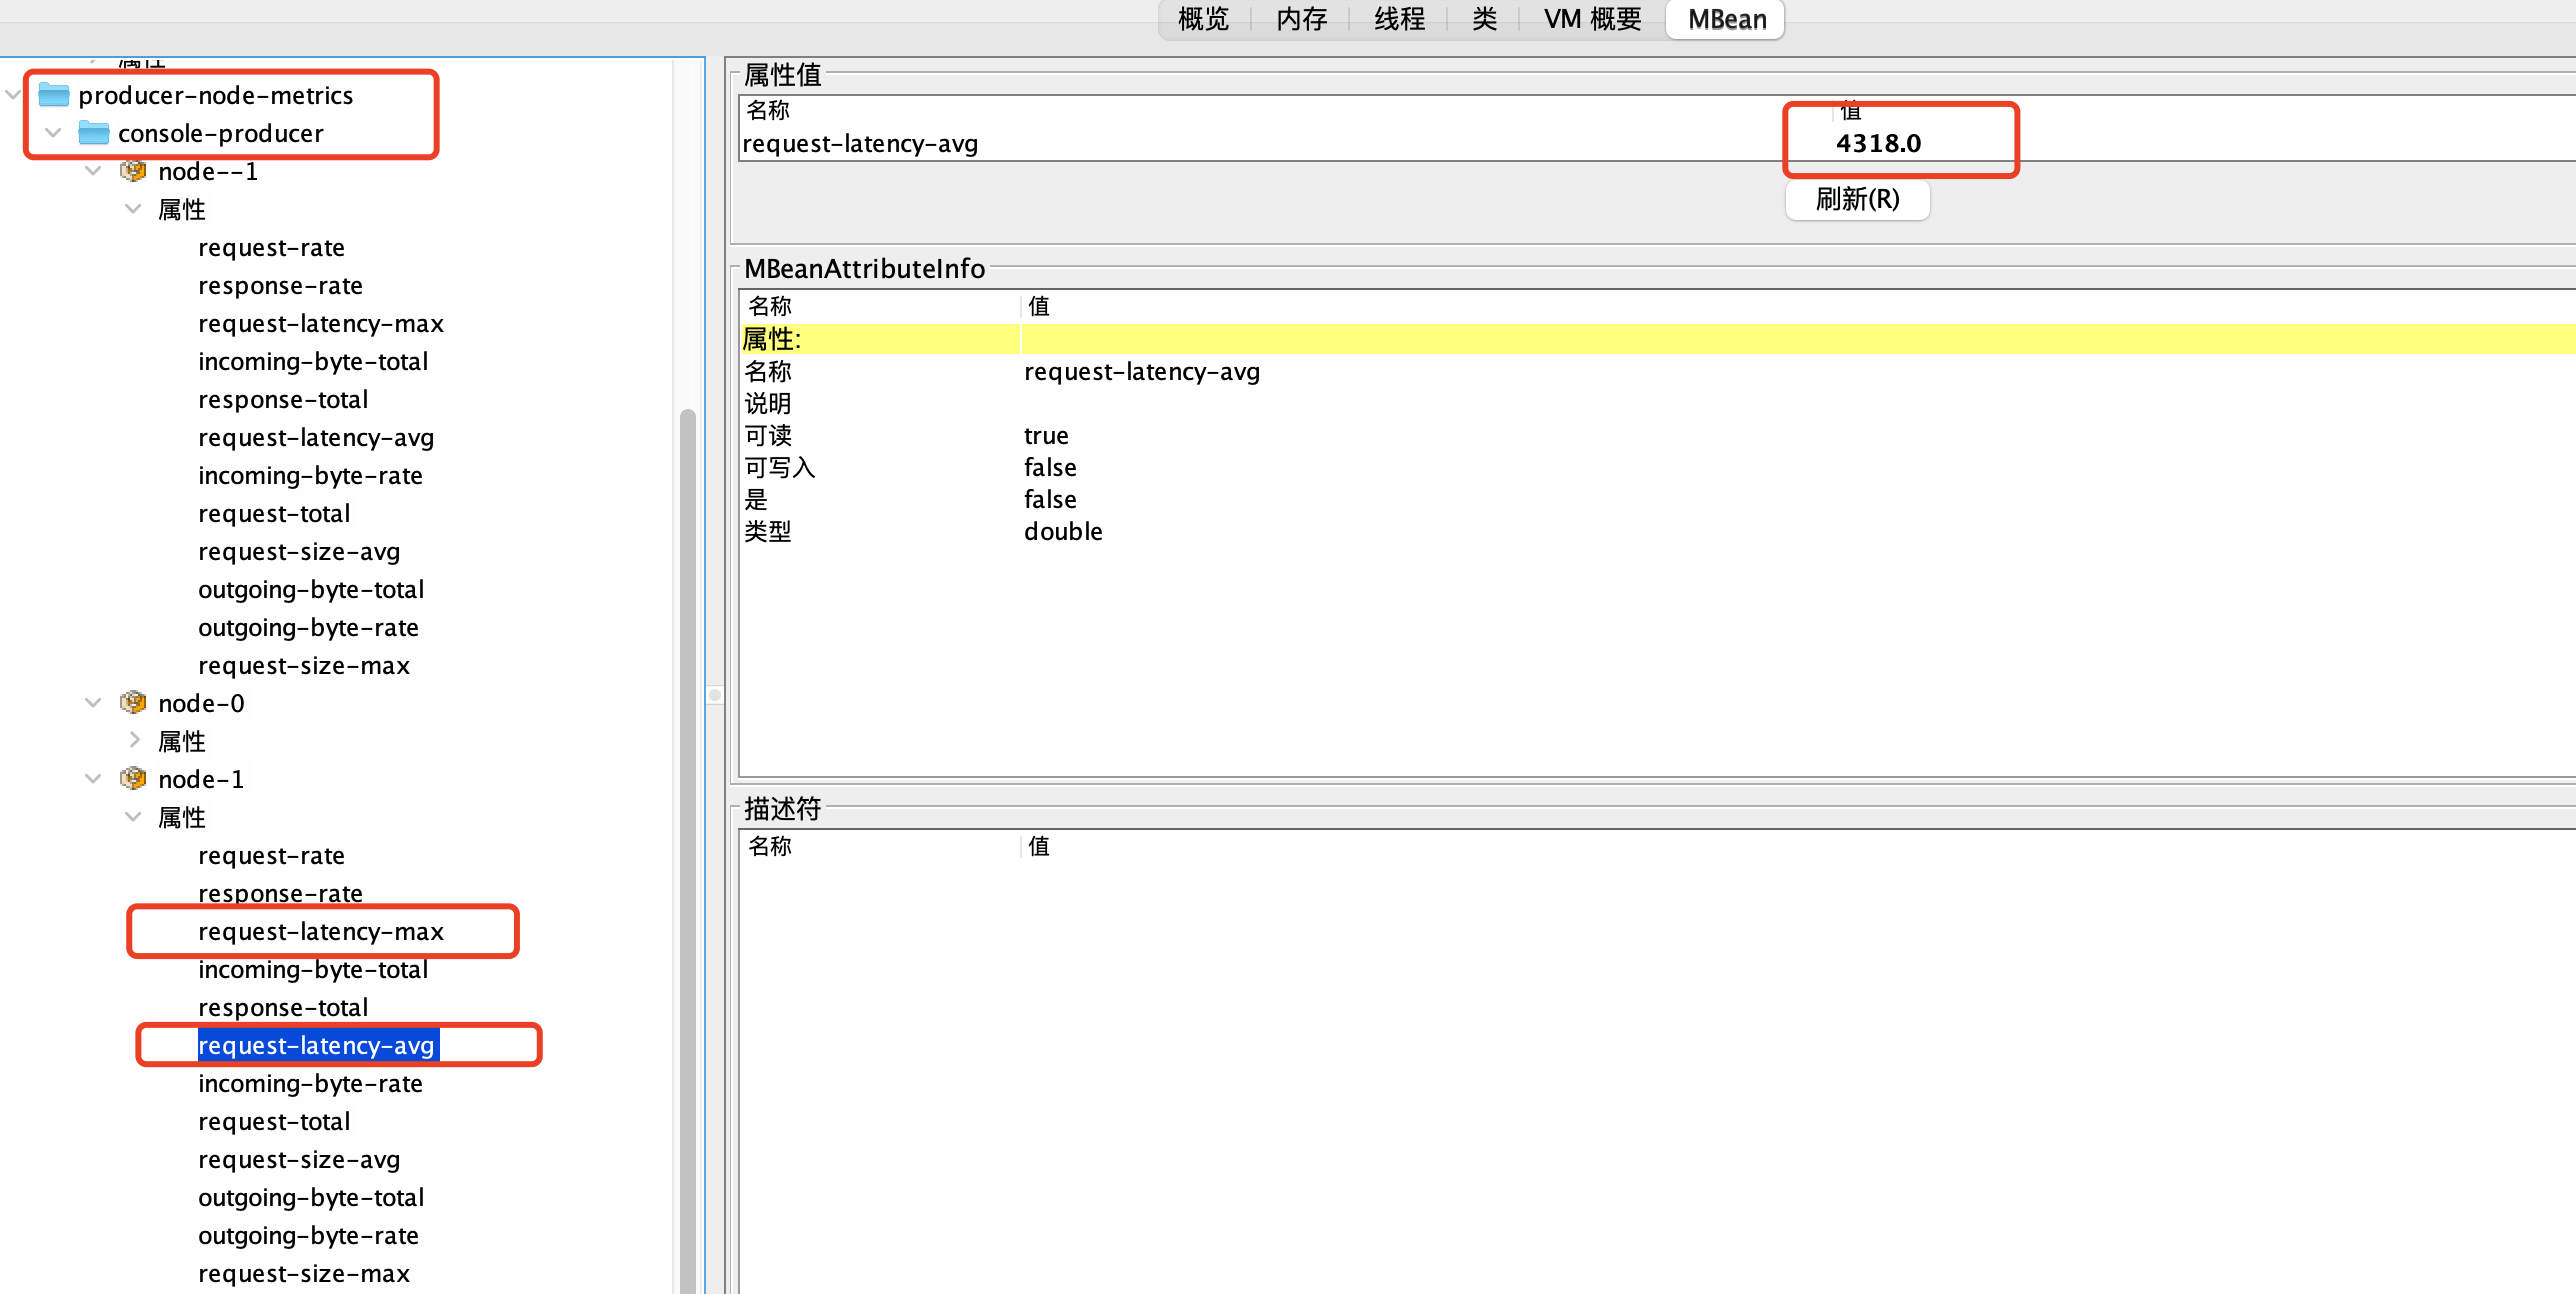
- 排查Request请求的性能问题,可以通过Jmx指标:
request-latency-avg(请求延迟的平均值)、request-latency-max(请求延迟的最大值)
这个指标有两个可以监控的ytpe
①. type =producer-metrics监控整个生产者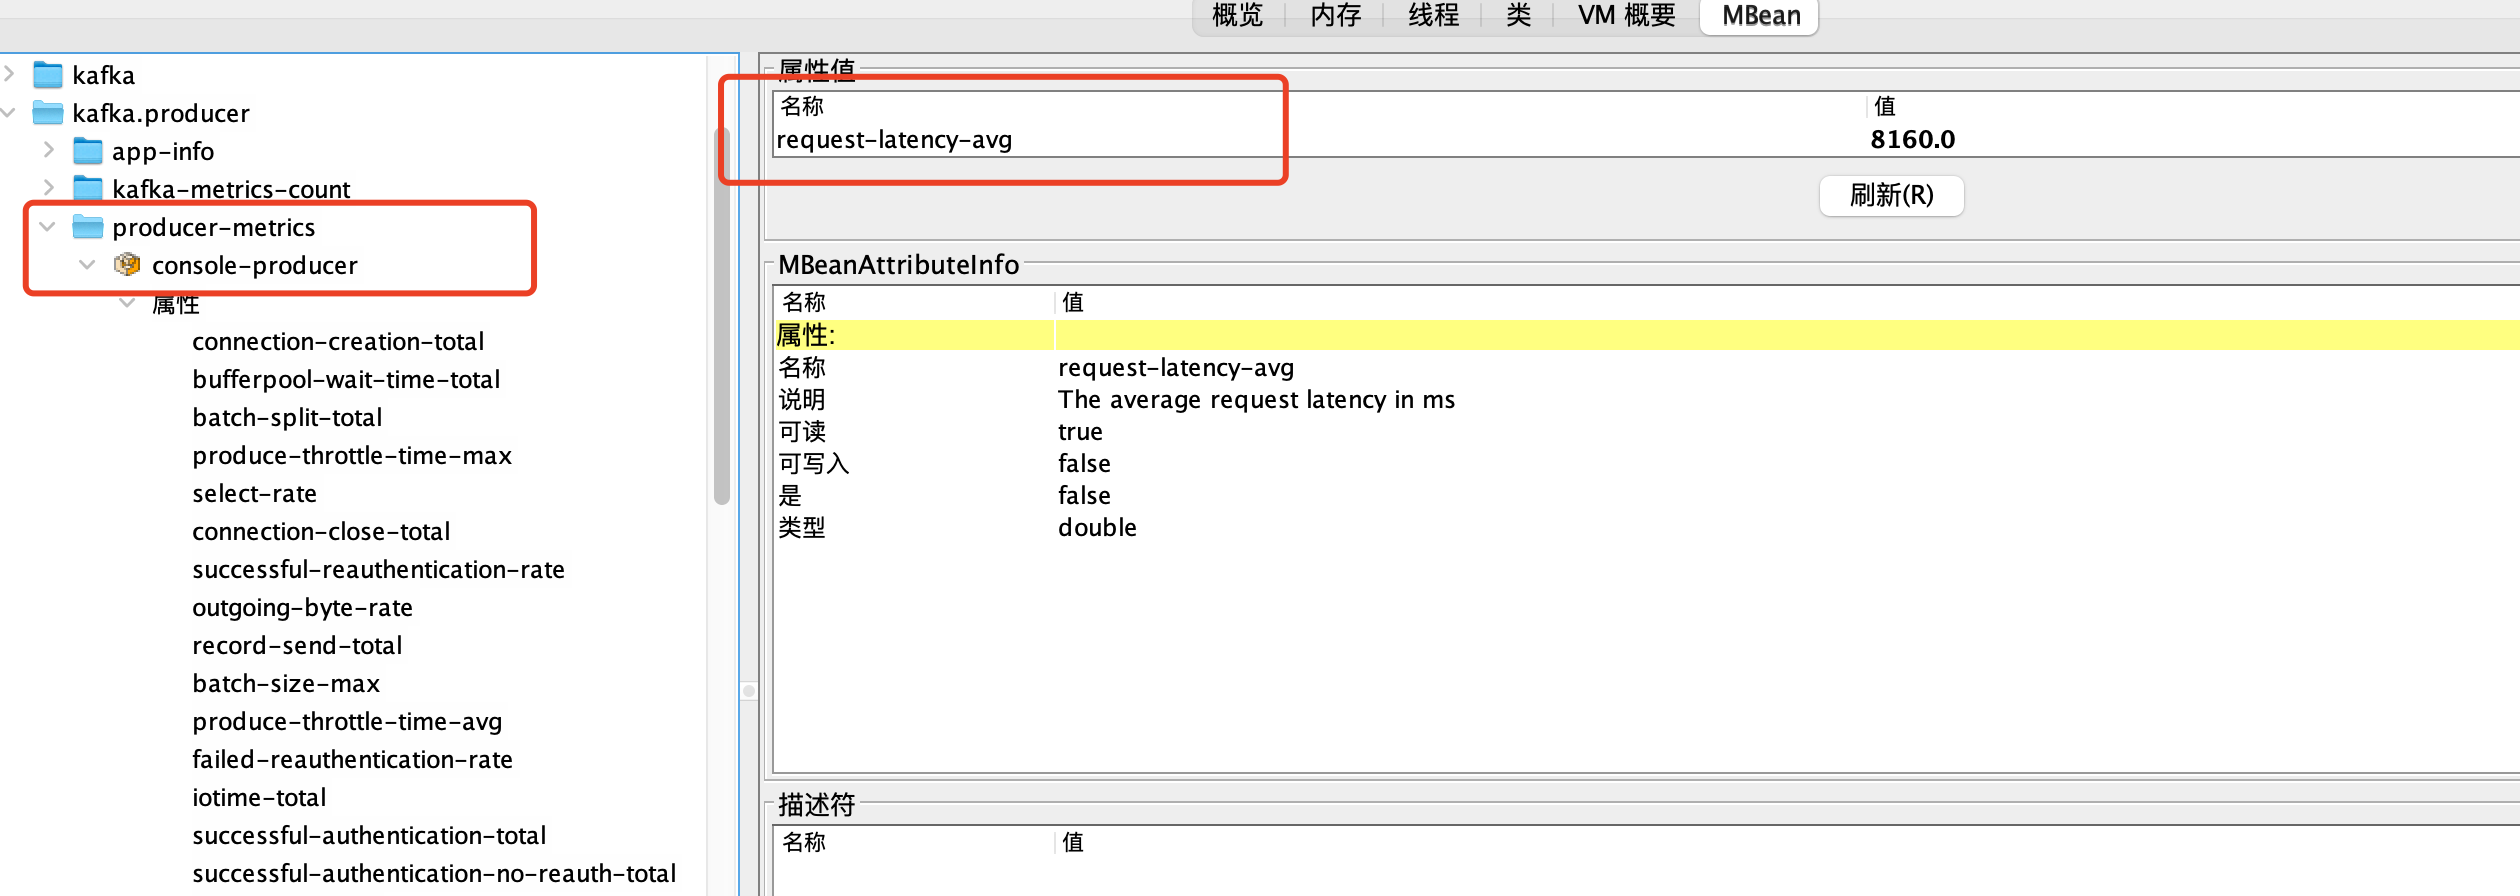
②.type =producer-node-metrics监控生产者与具体的Node的指标
delivery.timeout.ms设置大一点
可以通过监控 producer-metrics 来判断是否存在Request请求性能问题,然后通过 producer-node-metrics排查具体哪个Node有问题
作者石臻臻,工作8年的互联网老兵,丰富的开发和管理经验,全网「 粉丝数4万 」,
先后从事 「 电商 」、「 中间件 」、「 大数据」 等工作
现在任职于「 滴滴技术专家 」岗位,从事开源建设工作
目前在维护 个人公众号「 石臻臻的杂货铺 」 ; 关注公众号会有「 日常送书活动 」;
欢迎进「 高质量 」 「 滴滴开源技术答疑群 」 , 群内每周技术专家轮流值班答疑
可帮忙「 内推 」一二线大厂

 微信
微信


石臻臻的杂货铺
Java/大数据/中间件/教学视频